


January 2015 Blog Income + Traffic Report
It’s a new year (February already? what?) and I’m excited to dive into some of the behind-the-scenes of how I made my money with my blog last month.
(My hope is that by doing these blog income reports you can you can learn along with me, so please let me know in the comments if there’s something more or different that you’d like me touch on next time!)
If you’re just joining me, this is my third month monetizing the Olyvia site. The first month I made about $90 and the second I made only $2.
Let’s see what happens!
OLYVIA.CO BLOG TRAFFIC REPORT
Pageviews: 3,411 (+23 from last month)
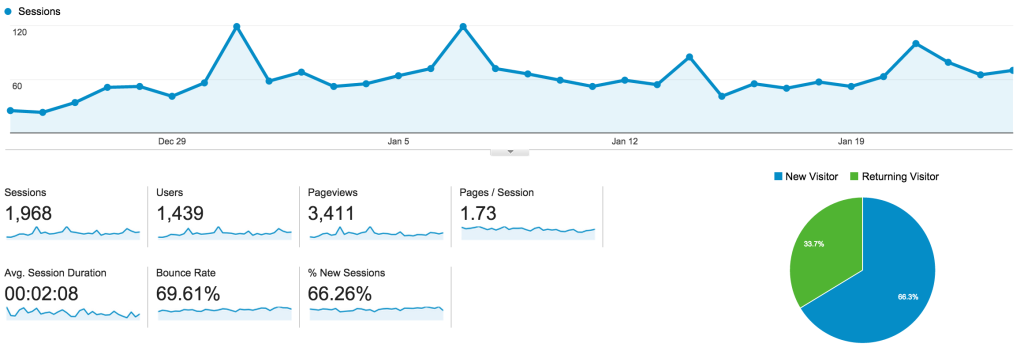
Things held steady this last month as far as traffic, but when I looked closer at the stats, I noticed two important things.
My bounce rate went down and the average time people spent on my site went up.
This is a good sign and an indicator that:
A) I’m either producing more interesting/targeted content, and/or
B) I’m making other posts easier to find.
(Hopefully both!)
I have noticed that people are regularly clicking the Disqus “Related Posts” links now, so that’s certainly helping with getting people to other areas of my blog.
(If you don’t use Disqus, Shareaholic has a related posts option within their plugin. This is what I used previously for my related posts. I like them because they include social sharing options, eliminating the need for two different plugins.)
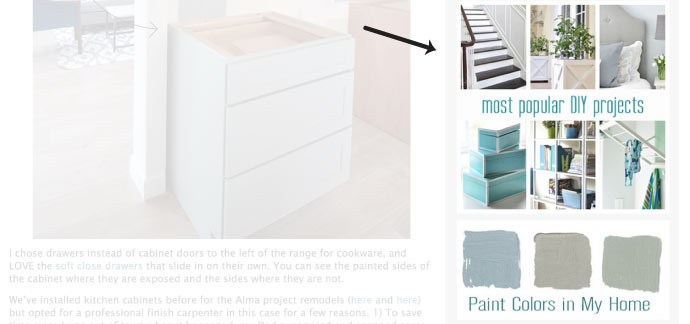
To encourage my visitors’ to spend more time on my site I’m also going to add in more images of older posts in the sidebar.
If you want to do something similar (and I recommend you do), an easy option on WordPress is to use a “Recent Posts” or “Top Posts” widget.
But you can also make your own custom images (for either posts or entire categories), place them in the sidebar, and then make that image link to places around your website.
This is how A Beautiful Mess does it:

And what it looks like on Centsational Girl:
Top 10 pages viewed this month:
Thanks to the power of Pinterest, my post on getting noticed on Facebook moved up to #2.
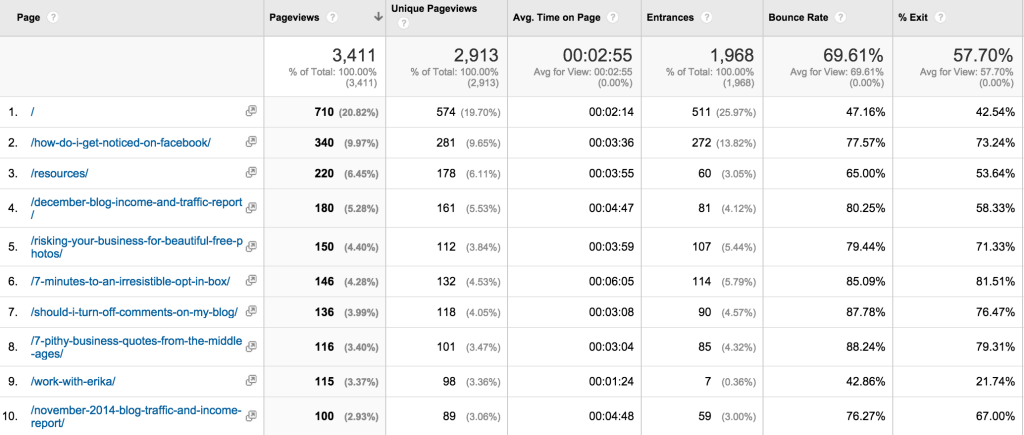
Quick tip for you here: when you look at these stats for your own page, don’t forget to look at the right-hand columns that say Bounce Rate and % Exit.
The bounce rate for a page tells you how many people ONLY viewed that page before leaving your site entirely.
The % exit tells you how many people left your site through that page. (Meaning, after perusing your site, that was the page they last viewed before leaving.)
A high bounce rate can indicate a problem; a % exit rate less so…but it’s still worth noting if it’s much higher than the rest of the site or, say, it’s happening in the middle of a multi-page article.
Therefore it’s a good practice to take note of which pages have the highest bounce rates and exits, and go back to see if there is anything there that is turning people off.
(Or if there’s anything you can add to the post/page to get people to go view more of your blog.)
If you take a look at my stats above, I’ll want to review my 7 Pithy Business Quotes From The Middle Ages post and see if there’s a way I can tweak or add to it (ie: with a link to related content) to get people interested in viewing other parts of my blog.
Top 5 traffic sources this month:
The significant thing this month is that my search engine traffic through Google rose two spots from #5 to #3.
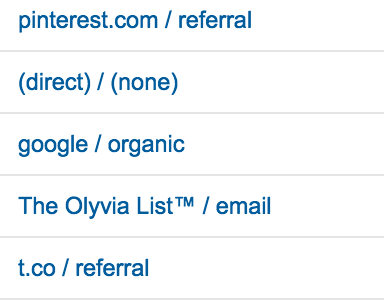
This means my page is finally (hallelujah!) being found in searches.
(Since I started out with no content and a new domain, it took time for Google to like me. 😉 If you’re in the same situation, you can help your efforts significantly by using a plugin like WordPress SEO by Yoast and being sure to use it to optimize each and every blog post you make.)
Top search query driving traffic to Olyvia.co: “pinterest smart feed” and “byregina” (for the interview I did with Regina of byRegina.com)
Top post of all time: How Do I Get Noticed On Facebook (part of this blog series on how to stand out online)
Now let’s look at my blog income report for January.
OLYVIA.CO BLOG INCOME REPORT
As I’ve mentioned in past income reports, the figures below are what I made through “passive income” on this blog, not my other client work and services.
This is because my goal is to give you an idea on how to make money with a blog that is not heavily dependent on your experience, unique niche, offline networking efforts, and other variables.
Last month’s earnings are as follows:
- BlogHer Ads - $1.11
- Lijit (Sovrn) Ads - $0.59
- Amazon Associates - $9.48
- Grammarly - $5.00
- Moo - $1.00
GROSS EARNINGS: $17.18
Last month I made $2.80 which means my earnings increased by $14.38.
(I know. It’s “only” $17. But can I just say that ANY passive income at all makes me want to do a little happy dance?!)
That said…I was disappointed in my Sovrn ad performance this month.
My earnings were only half of what they were last month. Why? They simply didn’t serve up the ads.
I’m not sure why that was, but it could have been due to their ad inventory running low.
This is one reason why it’s sooo helpful to have a passback ad tag in place. (Also called a backfill ad or backfilling.)
A “passback” or “backfill” ad is where you set up another ad to display if the first ad network doesn’t have ad inventory to serve on your website.
(I do this directly through my Sovrn ad dashboard. Sometimes you have to directly email an ad network to have them do this for you.)
Ideally I’d like this passback ad to be another pay-per-impression ad, but since I’m not a member of another ad network at this point (besides BlogHer, which can’t be used as backfill), my default passback is a regular affiliate banner ad from Amazon.
This isn’t great because it requires someone to click through and then buy something in order for me to earn any money. (That doesn’t happen often, as you can expect.)
Once I get my traffic up a bit higher I will try for some other networks to try to get some backfill ads stacked up. I could go with Google Adsense, but I’ve decided against that for now due to quality concerns.
Anyhow, I made some adjustments to my Sovrn ad as an experiment in the meantime and we’ll see what happens. I’ll report on what I did + the results next month.
+ SOCIAL MEDIA STATS
- Twitter: 1,893 (+ 151 from last month)
- Facebook: 269 (+36)
- Pinterest: 522 (+ 89)
- LinkedIn: 827 connections/862 followers (+ 48 / + 47)
- Instagram: 111 (+ 12)
- YouTube: 8 (+ 2)
I decided to put the bulk of my effort into Pinterest for a few months. So far this is paying off nicely, which I’m happy to see.
(This is the highest month for me in terms of new Pinterest followers.)
My traffic from Pinterest has grown significantly from just a few months ago and I’m getting more repins than ever on my content.
In that vein, I read an interesting article the other day that recommended deleting any pins on your boards that had 0 re-pins (or, if you’re brave, even 1, 2, or 3 repins).
The logic went that by leaving only the highest repinned content on your boards, this supposedly tells the Pinterest computer that your pins on that board are massively high quality + popular.
And thus, Pinterest will show them to more people.
I don’t know if it’s 100% accurate advice, but this particular blogger implemented it and claimed to see a huge jump in re-pins + follower growth.
You can read the post for yourself here: 9 Reasons You Should Be Deleting Your Pins
After I read it I began cleaning up my main boards a little bit (this was right after the cut off date for this income report) and I must admit, I am seeing some truth to it.
I hope to report more on this next month once I do more deleting and curating!
Your turn: please share with me how your blog traffic or income changed (for better or worse) last month. If you do income reports on your blog, I’d honestly love for you to leave a link so I can read and learn from you as well.

(Chief Olyvia)